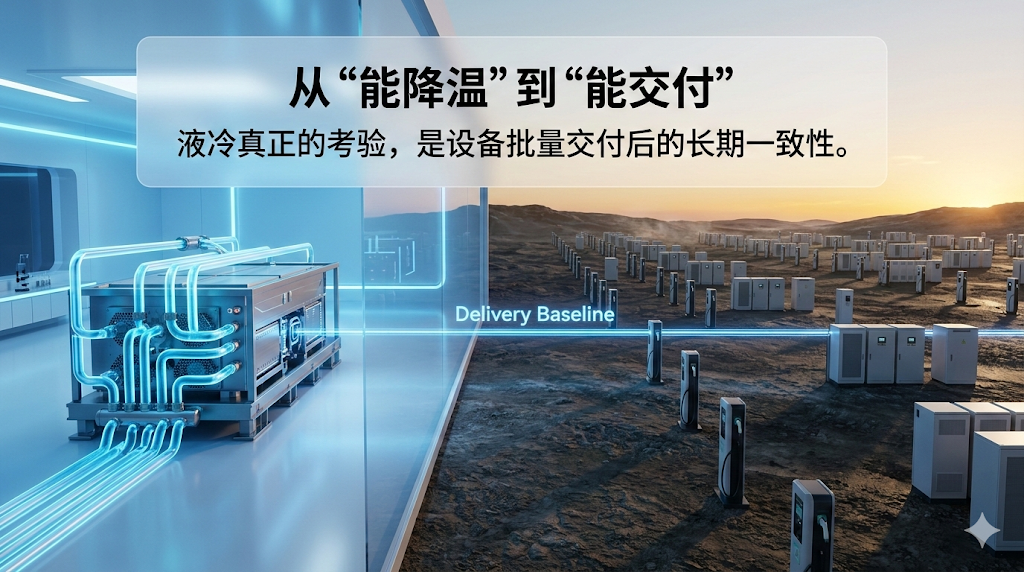
Opening: You Know the Direction, But How Do You Put It into Practice?

In the previous article, we discussed the three capabilities required for scalable delivery of liquid cooling systems: baseline solidification, on-site visibility, and parameter recovery. These three capabilities sound clear in theory, but how to implement them in an actual project is another question.
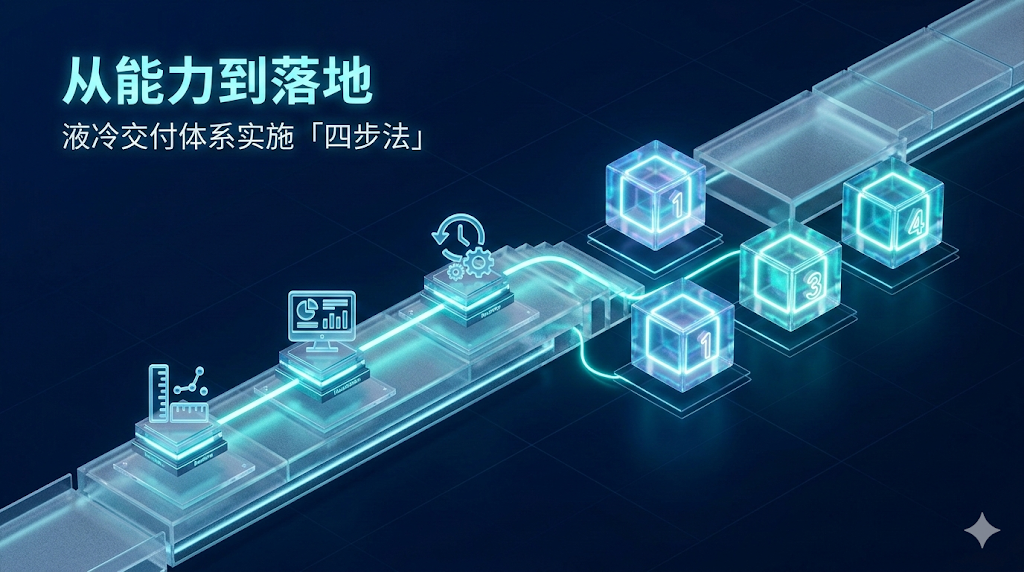
This article takes an implementation-oriented perspective and explains the four concrete things you need to do to truly apply this framework to your EV charging or energy storage liquid cooling system.
Step 1: Turn Commissioning into a Process, Not Experience
In EV charging and energy storage applications, commissioning of a liquid cooling loop should not stop at simply checking whether the temperature can be controlled. A more engineering-oriented approach is to divide the commissioning process into three clear stages, each with its own outputs and checklist.

The first stage is baseline establishment. Run the equipment under a stable load and record the flow rate, pressure, supply and return water temperature, and temperature difference under normal operating conditions. This baseline is not a fixed value, but a dynamic reference. It tells you what the system should look like during normal operation. Any deviation afterward can be compared against this baseline. When establishing the baseline, pay attention to environmental factors—do not perform commissioning under extreme temperatures, and do not record data while there is still air in the piping. Let the system run long enough until all parameters become stable. In general, 30 minutes to 1 hour of stable operation is sufficient.
The second stage is trend acquisition. Run the system for 30 minutes at two or three typical operating points and record the rate of change in pressure and temperature. These may be light load, medium load, and full load, or any other classification based on your actual application scenario. These rates are extremely important because they allow you to distinguish between “normal gradual change” and “abnormal rapid deterioration.” If the rate of pressure increase suddenly accelerates, it may indicate that the piping is beginning to clog; if the rate of temperature-difference increase becomes abnormal, cooling efficiency may be deteriorating. With these reference trends, maintenance personnel can judge not only by instantaneous values, but also by tendencies over time. This is an important basis for fault diagnosis.
The third stage is alarm and interlock configuration. Based on the baseline and trend data, set layered thresholds. A no-flow interlock is an emergency protection function and should be triggered immediately when the flow switch loses signal. Pressure and temperature warnings are maintenance reminders and should give personnel enough time to respond. Temperature-difference monitoring is a performance boundary and should be recorded, but not necessarily trigger an alarm immediately. One very important point in this process is: do not set thresholds too tight. An alarm that triggers frequently by mistake is worse than having no alarm at all, because it creates a “cry wolf” effect, and over time people will simply ignore it.
This process may seem standardized and cumbersome, but once it is established, it becomes a repeatable standard. When a new batch of equipment arrives, if commissioning is carried out according to the same process, the delivered systems will share the same foundation of reliability. Commissioning turns from experience-based work into a process, and that is the real basis of scalability.
Step 2: Speed Up On-Site Troubleshooting with a Three-Step Diagnosis Method
The after-sales cost of unmanned outdoor equipment is often amplified by the troubleshooting path. Many problems are not difficult to fix—the diagnosis is simply too slow. What visualization really needs to solve is shortening the troubleshooting path to a controllable range.
In liquid cooling systems, the three most common on-site questions are: Is there any flow? Has the loop resistance increased? Has the heat exchange capability declined? If the measurement points are designed properly, maintenance personnel can determine the direction of the issue in just three steps through three indicators.

Step 1: Check the flow status. Does the flow sensor or flow switch have a signal? Is the liquid circulating? If there is no flow, then the issue is related to flow interruption or the pump. It may be a pump startup failure, a clogged inlet filter, or an air lock in the piping. But regardless of the cause, the first maintenance direction is very clear: inspect the pump and inspect the inlet. If there is flow, then at least the liquid is circulating, and we can move on to the next step.
Step 2: Check the pressure. What is the current pressure? Is it higher than the baseline? If it is significantly higher—for example, rising from 2 bar to 3.5 bar—this indicates that resistance in the piping or filter is increasing. At this point, the maintenance direction is also very clear: check whether the filter needs replacement, and check whether there is trapped air or scaling in the piping. If the pressure is normal, then this category of blockage-related issues can be ruled out.
Step 3: Check the temperature difference. What is the inlet-outlet temperature difference? Compared with the baseline or typical operating condition, is it higher than normal? For example, if the temperature difference used to be 8°C at full load and has now increased to 12°C, this means the coolant is circulating, but the heat exchange capability has declined. Possible causes include coolant degradation, fouling in the heat exchanger, or blockage in the air-cooling section. In this way, the maintenance scope is narrowed down even further.
As long as these three data points are clearly visible, the after-sales team can bring the right spare parts and follow the right steps on the very first visit, instead of figuring things out by trial and error on site. If a device allows maintenance personnel to see the flow status, pressure value, and temperature display right at the control cabinet door, troubleshooting efficiency will improve dramatically. When on-site visibility is done well, the user experience improves very directly: fewer service calls, faster recovery, and more stable reliability perception.
Step 3: Turn Maintenance into a System, from Sensors to Actuators
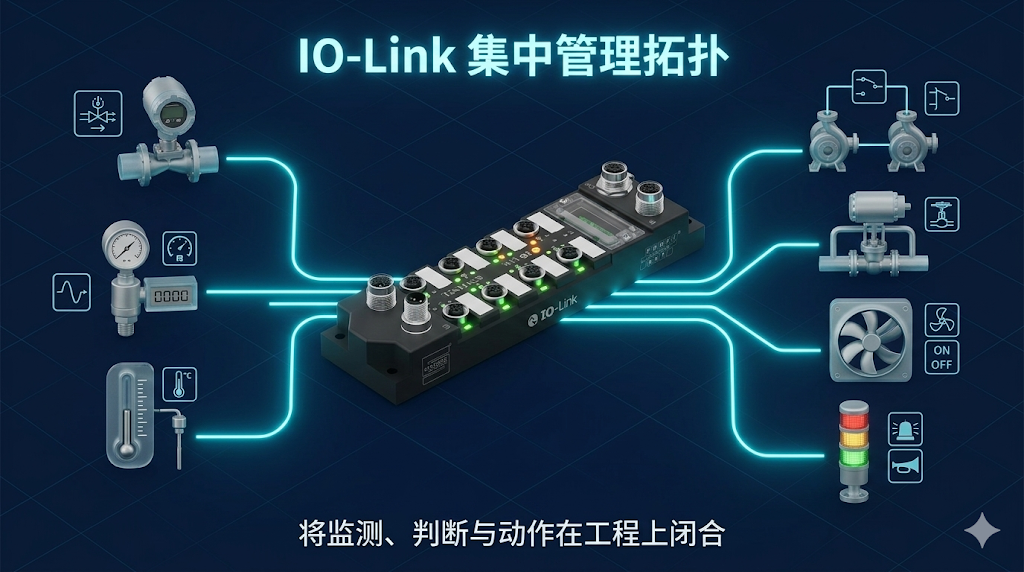
Recoverability in a liquid cooling system does not apply only to sensors. In many cases, what really needs to be restored is the “action logic”—pump redundancy switching, bypass valve opening, fan start/stop, and audible/visual alarm outputs. If these control points are scattered across traditional hard wiring, on-site modification and maintenance will become increasingly difficult, and batch consistency will also be hard to achieve.
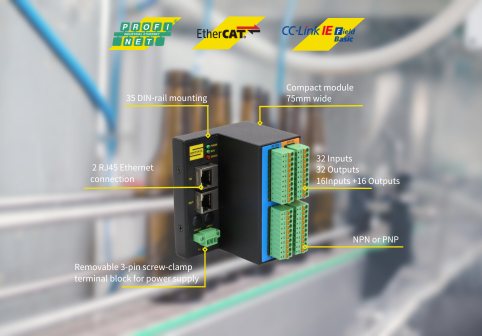
In such scenarios, using IO-Link remote I/O or relay expansion modules to centrally manage action points is more in line with the idea of “scalable delivery.” A multi-channel relay module with IO-Link V1.1 communication can centralize multiple outputs within a standard DIN-rail structure while providing clear channel status indication and contact capability. In this way, the “monitoring–judgment–action” chain of the liquid cooling system can be closed in engineering terms and gain the basis for standardized replication.
More importantly, once this system is established, after-sales service no longer has to “guess.” The system tells you which alarm layer it is currently in, which action channel has been triggered, and whether the trend has crossed the warning window. Maintenance moves from experience to process, and delivery moves from one-off execution to repeatability. Once parameters need to be updated or components need to be replaced, synchronization can be completed quickly through the IO-Link protocol, avoiding situations where “the same model behaves differently.”
Step 4: Use Data to Drive Continuous Optimization

Once equipment enters large-scale deployment, the most valuable thing is no longer the “instantaneous reading” of a single site, but the baseline comparison of the same model across different sites. As long as parameters are recoverable and data is traceable, you can work backward from after-sales data to improve the design.
For example, suppose you collect operating data from 100 EV charging stations in different cities and seasons. You find that in northern regions during winter, filters clog 40% faster than in southern regions. What does that tell you? It may mean that the liquid in the north contains more impurities, or it may mean that changes in coolant viscosity at low temperature are making the flow unstable. In either case, this provides a direction for next-generation product improvement. Or perhaps you discover that the temperature-difference trend at some sites continues to rise while the pressure remains normal. This suggests that the issue may not be blockage, but rather declining efficiency of the coolant itself. That is also highly valuable information.
In this way, the liquid cooling system moves from “passive firefighting” to “continuous optimization.” Every field failure and every trend record is helping you improve the product. That is the reliability closed loop equipment manufacturers truly want.
Typical Implementation Case: Ultra-Fast Charging Liquid Cooling Unit

Take an ultra-fast charging liquid cooling unit as an example to see how these four steps can be combined.
The biggest concern in ultra-fast charging is flow interruption leading to power derating or protective shutdown. The traditional approach is often either to install a flow switch that shuts the system down when triggered, or not to install one at all and rely on a temperature alarm to respond later. Neither is an elegant solution.
A more engineering-oriented method works like this: during commissioning, run the unit for 30 minutes each at light load, medium load, and full load to establish baseline and trend data for flow, pressure, and temperature. Suppose you find that at full load, the pressure stabilizes at 2.5 bar and the temperature difference stabilizes at 10°C. Then, after two months of field operating data, you find that the normal rate of pressure increase is 0.1 bar per month (which is the natural result of gradual filter clogging), while the normal rate of temperature-difference change remains basically flat.
You can then layer the alarms accordingly: the flow switch triggers an immediate interlock shutdown when there is a complete loss of flow (protection level); if pressure rises by more than 0.3 bar within one week, a “check filter” warning is triggered (maintenance level); if the temperature difference begins to rise significantly, the trend data is recorded but no alarm is triggered immediately (performance level).
When maintenance personnel arrive at the equipment, they can immediately see the flow indication, pressure reading (2.8 bar), and temperature display (inlet 25°C, outlet 33°C, temperature difference 8°C). By comparing this with the baseline, they know: there is flow, the pressure is slightly higher than the factory condition but still acceptable, and the temperature difference is actually lower (possibly because the ambient temperature is lower than the test condition), so the system is overall in good health. Or, if they see the pressure has risen to 3.2 bar, they know filter maintenance should be scheduled for the weekend. Or, if they see the temperature difference suddenly jump to 15°C, even though the system has not alarmed, they know cooling efficiency is deteriorating and the cooler needs cleaning.
Once you deploy 100 such charging stations, the backend system aggregates data from all sites. You may find that at one charging site in the north, the rate of pressure increase is much faster than in other locations. This triggers design review: Is there an installation problem at that site? Is the fluid quality different? Does the coolant replacement cycle need adjustment? All of these become questions that can be answered with data.
Companies that implement this framework typically see improvements such as: first-time fault localization success rate increasing from 40% to 85%, average work-order handling time decreasing from 4 hours to 1.5 hours, repeat service visits dropping from 30% to 5%, and fault detection before actual failure rising from 20% to 70%.
Conclusion
In the liquid cooling systems used for EV charging and energy storage, the real competition in the end is not about one or two test results, but about delivery consistency and maintenance efficiency. By solidifying the baseline, getting on-site visibility right, building parameter recovery into a system, and then implementing all of these in concrete commissioning processes, troubleshooting methods, and maintenance chains, you can turn the uncertainty of distributed deployment into an engineering capability that is manageable, predictable, and continuously improvable.
As a result, the liquid cooling system is no longer merely a “cooling tool,” but an engineering asset with lifecycle management, standardized processes, and continuous optimization mechanisms. That is what true scalability really means.
FAQ
1. What are the most critical capabilities for achieving scalable delivery of liquid cooling systems?
Scalable delivery of a liquid cooling system is not just about designing the system itself. More importantly, it is about turning the delivery process into a repeatable engineering framework. The core lies in three capabilities: baseline solidification, on-site visibility, and parameter recovery. Only by first establishing normal operating conditions as a unified reference, then making on-site status easy to judge, and finally enabling rapid restoration of consistency after component replacement or parameter adjustment, can a liquid cooling system truly support batch deployment and long-term operation and maintenance.
2. Why is on-site maintenance of liquid cooling systems often slow? Where is the real problem?
In many cases, the issue is not that the fault itself is difficult to handle, but that the troubleshooting path is too long. If field personnel cannot see the key data, they can only investigate one item after another, which leads to slow judgment, wrong spare parts, and repeat visits. A more efficient method is to build a three-step diagnosis approach around the three core indicators of flow, pressure, and temperature difference: first confirm whether there is flow, then determine whether loop resistance is abnormal, and finally determine whether heat exchange performance has declined. This allows the fault direction to be locked in much faster and significantly improves maintenance efficiency.
3. Why is the long-term competition in liquid cooling systems ultimately about continuous optimization?
Because once liquid cooling systems enter batch deployment, their value is no longer reflected only in whether a single unit can run, but in whether they remain controllable, predictable, and improvable across different sites, seasons, and operating conditions. As long as data is traceable and parameters are recoverable, companies can work backward from after-sales data to identify design issues and refine maintenance strategies, turning repeated field experience into optimization input for the next generation of products. Only then can liquid cooling systems move from “passive firefighting” to “continuous optimization.”
Customer Support & Service
Tianjin Sentinel Electronics has been deeply engaged in the industrial automation field for 17 years and has provided more than 170 application cases for industries such as rail transit, automotive manufacturing, and new energy. We provide full-cycle services ranging from sensor selection and system integration to after-sales diagnostics. If you would like to learn more about Sentinel products, please contact our sales team or call us at +86-22-83726972. You may also visit our website at www.sentinel-china.com.
Welcome to book an online demo or apply for sample testing, and let our engineers tailor a complete solution for you from “data entry” to “action implementation.”